CiPol
CiPolOpen Source Jenkins Monit
- 类型:软件开发工具
- 评分:0.00
- 年龄要求:4+
- 是否收费:免费
- 语言: "EN"
- 星级:
- 上传者:Ron DORN
- 更新时间:2024-03-17 06:58:20
CiPolOpen Source Jenkins Monit
CiPol
Open Source Jenkins Monitoring Tool
Introduction
CiPol (Continuous Integration Poller) is a simple program to help you monitor your Jenkins builds. This software is open source and made available via the GPL license.
The jenkins servers at my company do a good job of notifying the developers who check’in code if they caused an issue that broke the build. That being said, if you are NOT the developer who checked in the code, but still need to know something went wrong, you might not notice for some time. This will monitor selected Jenkins builds, at a polling interval of your choosing, and let you know if anything changes.
Setup
Server Setup
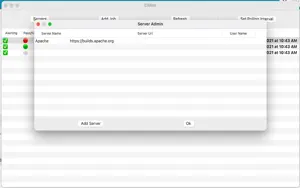
To start with you must define a Jenkins server. Click the ‘Servers’ button on the main window. This will open up the Server Admin screen. From there click the ‘Add Servers’ button.
From here you can pick any ‘Server Name’ of your choosing. The url should be the form of “’. If there is a specific subdirectory you are interested in scanning, you can add that on here, but it is not required.
Username and API Token are optional. If your server does not require authentication to view jobs, you can leave these blank. If it is required, you must use an API Token issued by your Jenkins server. All tokens are stored securely in your Mac OS keychain. To get an API Token from your Jenkins server, go to your user settings and then go to Configure, from there you should see an API Token section where you can generate a token.
To modify an entry, you can double click on a server line and make changes.
To Delete an entry, you can right click and select Delete.
Job Setup
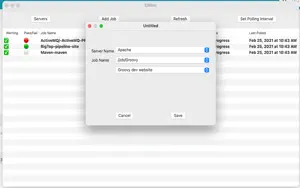
Once a server is set up, you can now set up a job. To set up a job click the ‘Add Job’ button. From there you will see two pull down menus. For the server menu select one of the servers you have just set up. This will populate the job menu with available choices scanned from your server.
If a choice is represented as /job/{job name}, it means that it is a folder and not a direct job. If you chose one of these entries then a new pull down menu will appear with the job present under that folder. Up to 4 menu levels are supported. Once you have chosen the job you wish to monitor, click ‘Save’
The menu will only be populated with folders and jobs that have passing or failing tests. If a test is disabled it will not appear in the menu.
Main Screen
The following features are available on the main screen
You can double click any job to take you to that job on your Jenkins server in your preferred browser You can click on the ‘Refresh’ button to immediately update all job data displayed You can click on the ‘Polling Interval’ button, and adjust how often your data is automatically polled from the Jenkins servers and refreshed. The default is 10 min You can right click on any job and select Delete to remove it You click on the ‘Monitoring’ checkbox in the left most column and change this from off to on When monitoring is off you will not receive alerts when the status changes When the monitoring is off the icon in the tray bar will not be affected by the test outcome.
Privacy Policy
No data of any kind is collected by this program. The only outgoing network traffic this program produces is to the Jenkins servers that you have configured. All notifications are handled locally.
版本更新内容:
Fixed an issue where if you added a Jenkins job that was 4 levels deep, under some circumstances the URL would not be correct
相关TAG: 软件开发工具
 查看
查看

效率 ¥38.00
 查看
查看

软件开发工具 免费
 查看
查看
软件开发工具 免费
查看
 查看
查看
 查看
查看

软件开发工具 ¥8.00
软件开发工具 免费
软件开发工具 ¥8.00
CopyRight 2019 https://www.diewufeiyang.com All Rights Reserved 滇ICP备2023012438号 Sitemap
运维笔记温馨提示:抵制不良游戏,拒绝盗版游戏,注意自我保护,谨防受骗上当,适度游戏益脑,沉迷游戏伤身,合理安排时间,享受健康生活!